
Live request flow visualizer ยท ASP.NET Core

NETAPIFLOW

Complex integrations. Linear flows.

Open source library for ASP.NET Core that shows, live, the path of every HTTP request inside your API, from endpoint to SQL command, with duration, failures, slow steps, and what never ran.
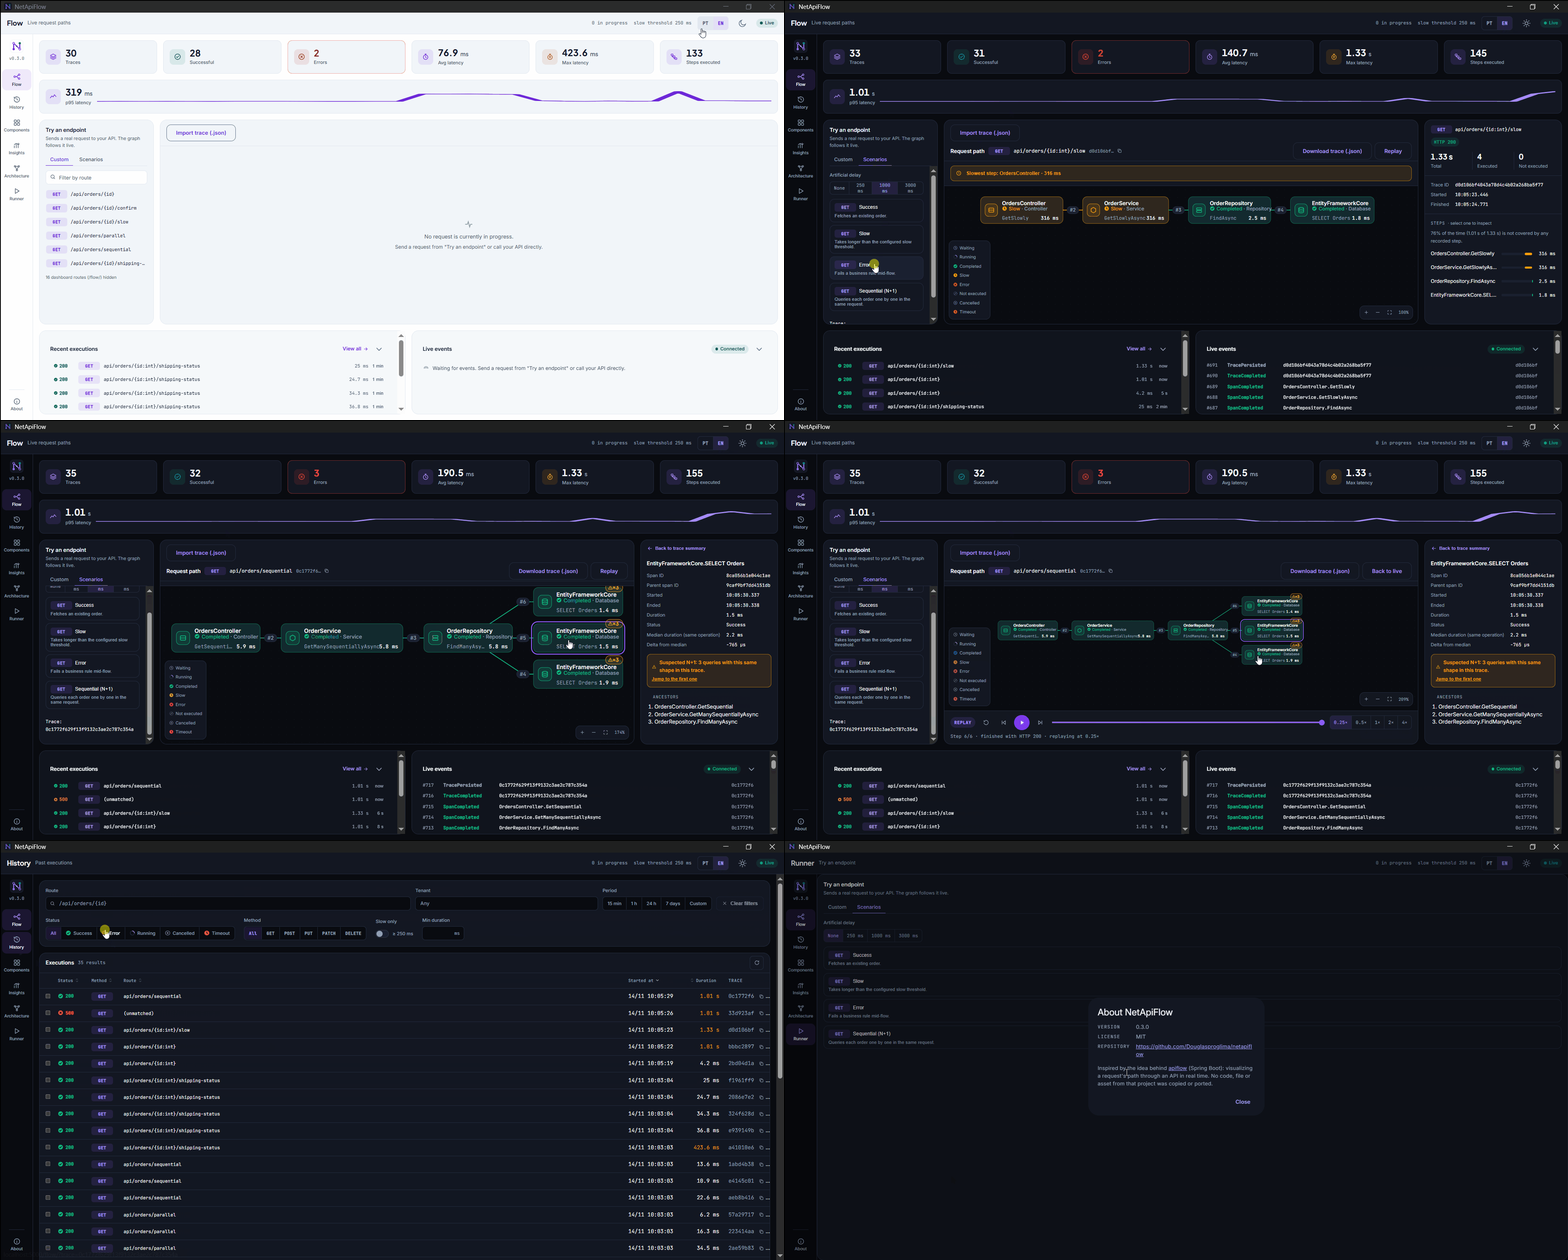
The NetApiFlow flow graph lighting up live as a real request executes

Engineering manifesto

Four principles that do not bend

01

Strongly Typed (.NET)

Native DI and ASP.NET Core middleware integration. Typed tracking events, no magic strings or reflection on the critical path.

02

Active Diagnosis

Shows where the failure began, what got slow, and what never executed. State is always color plus icon plus text, never just color.

03

Fluent Configuration

One NuGet package, a couple of lines of code, one local URL. Filters by layer, route and tenant composed in a fluent API.

04

Zero Overhead

Asynchronous collection, toggleable per environment. The request never waits on the dashboard to respond.

What it does

Three pillars

Live

Live Tracking

Real time graph of the request path. Endpoint, then Handler, then Services, then Repositories, then SQL. Works with Clean Architecture, Vertical Slices and MediatR.

Diagnose

Failure & Latency Diagnosis

Duration per step, exception origin, slow steps above threshold, and what never executed, without opening a debugger or mining logs.

Replay

Telemetry & Replay

Execution history with trace ID, filter by tenant and route, and a replay timeline with speed control to see exactly what happened.

Beyond the basics

The rest of the package

Tracing the request is just the start. The rest of the ecosystem helps you find a problem before it's an incident, and bring the trace to where you already work.

MCP

Ready for an AI agent

Your own API exposes an MCP server: an agent lists recent traces, fetches one by id, and reads per-component statistics, with no hand-written REST client.

OTLP

Interops with your stack

Exports the same trace to Jaeger, Tempo, Aspire Dashboard, Honeycomb, or any OpenTelemetry-compatible collector. Native Npgsql and HttpClient ingestion, no duplicate spans.

Insights

Sees what a single run can't

Automatic N+1 detection on the graph, an architecture map built from hundreds of real executions, and an aggregated view of the slowest and most error-prone routes.

Runner

Test a route without leaving the dashboard

Builds the form straight from your own API's OpenAPI document and fires a real request. On a protected route, paste the token once: the right header is applied automatically to every request, no copy-pasting it again.

And more: side-by-side diff between two executions, a trace exported as a file to take anywhere, smart sampling that keeps only what matters, log/exception correlation per step, and a deploy marker on the history timeline to correlate an incident with someone else's deploy.

Get started

Install one package, add a few lines

No separate service to deploy. The dashboard ships embedded in the package and runs next to your API.

Program.csillustrative example
// 1. install the package
dotnet add package NetApiFlow

// 2. register and mount the dashboard
using NetApiFlow;
using NetApiFlow.Dashboard;
using NetApiFlow.Dashboard.Endpoints;

builder.Services.AddNetApiFlow();
builder.Services.AddNetApiFlowDashboard();
// ...
app.UseNetApiFlowDashboard(); // mounted at /flow by default

Every step, color plus icon plus text

State is never color alone. It stays readable in grayscale, for color blind users, and on a black and white printout.

Waiting Running Completed Slow Error Not executed Cancelled Timeout